Herring Scrap 35: Ova-estimating // Hubris
Two days after the deadline for comments for the upcoming Board of Fisheries meeting in Ketchikan, Alaska Department of Fish and Game quietly revealed last week that they now believe that last year's forecast biomass of Sitka herring was an overestimate by double.
ADF&G buried that information in Fishery Data Series No. 24-25: Southeast Alaska and Yakutat 2024 Herring Stock Assessment Surveys (PDF), which they slipped into the meeting materials for the upcoming Board of Fisheries meeting last Thursday.
I've been refreshing the Board of Fish meeting page and the Southeast Alaska herring research page every day or two waiting for these results to get published. I'd hoped and expected that the information would be available in time to inform on-time Public Comments for the Board of Fish meeting in Ketchikan coming up in under two weeks. This sort of thing should be released in time for the Regional Advisory committees and the public to make informed comments on. The Regional Advisory committees have been meeting about this meeting for a couple months. The comment deadline was last Tuesday. Usually these Stock Assessment Survey reports come out in December. Not this year.
Again: the new document, released too late for public feedback, reveals that ADF&G overestimated last years Sitka herring forecast by double. It was not a record biomass after all.
ADF&G'd imagined that 406,000 tons of herring would return to spawn, and allocated a 20% GHL based on that number, inviting the sac roe fleet to take up to 81,246 tons of spawning herring from Sitka Sound. Now that they've had a chance to look at their spawn maps and their egg counts and their formulas and perhaps their mirrors, they've had a realization: Oops! There were only 199,322 tons of herring, give or take. This means that they invited the fleet to take 40% of the spawning herring in Sitka Sound, twice as much as the world's least sensible fisheries scientists, assiduously applying only the most outdated wisdom, think is an appropriate harvest rate for forage fish.

Luckily, due to weak markets for their lamentable product, the fleet could not justify their way to fishing that allocated amount. The seiners did not take 81,246 tons of herring; they took 12,678 tons. Even so, ADF&G cannot take credit for what the fleet didn't want to do; they can only take credit for what they were prepared to allow the fleet to do.
It was a bad idea even when it could be rationalized by data.
When ADF&G first released that forecast number, I wrote in Scrap 17: "The GHL of 81,246 tons of herring - the amount that ADF&G would be comfortable seeing a commercial fleet take in a month in Sitka Sound this spring - is equal to the amount taken in all the years between 1979 and 1992 combined! The scale of disruption required to catch that amount of spawning herring would be extraordinarily invasive, and even though it seems highly unlikely that it will even be approached (most ever was 25,090 tons in 2022, last year [2023] was just over 10,000 tons), it is alarming that it is on offer."
They overestimated by double, and managed the fishery according to that stunning overestimate. Not for the first time, either; this (overestimating by double) happened back in 2012 as well. This is why there needs to be a lower harvest rate. This is why there needs to be a hard cap beyond which more fishing shouldn't happen. This is why there needs to be a higher threshold below which fishing can't occur. This is why state money should go toward funding Tribal Co-management efforts instead of more biometricians. This is why it's important to recognize that these fisheries managers have no sense of history and even less sense of future. It's all so reckless, feckless, foolish.
I want to tell you something eggxtraordinary about where the numbers came from that made ADF&G wrongly think that 406,000 tons of herring would show up in Sitka Sound last year. It'll be a long walk to get there, so I want to tell you the headline now: 0.3% of egg deposition samples conducted in 2023 produced 44.6% of the eggs described by the 2023 survey effort. I think these unusual samples should have been rejected and ADF&G should never have assumed a record-breaking biomass in the first place. I'll explain:
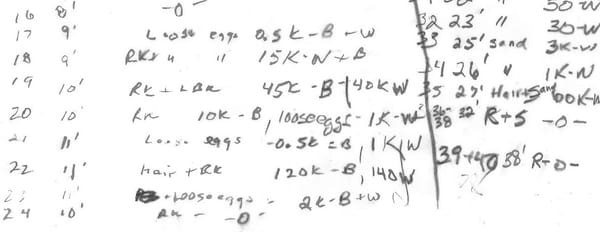
Sometime last year I reached out to the Department and requested their egg deposition data from the previous few years, 2021 to 2023. I knew from the Department's presentations that they'd encountered incredible densities of eggs at locations along the Kruzof Island shoreline, and I wanted to get a better sense of what that data looked like. I got distracted by something, didn't get around to loading it into ArcGIS like I'd planned.
But recently I went back to the spreadsheet I'd been given and looked at it a different, simpler way. There are 4083 rows of data - each corresponding to one sample (the number of eggs within a 0.1 m2 sampling frame in the water column) taken at a 5m interval along a transect perpendicular to shore - and I sorted them according to the number_of_eggs_thousands column so that the samples with the most eggs were at the top. I stared at the results for a while.
Three things struck me: the highest 50 or so samples were showed a WAY higher density than the rest; almost all of the samples with the greatest egg counts indicated "none present" in the vegetation_type column; almost all of those samples also indicated "loose" in the comment column, often with a rather stunning description. Here are those three columns (as well as year and transect) for the 10 biggest samples:
| year | transect | vegetation_type | comments | number_of_eggs_thousands |
| 2023 | 7 | None present | loose; 41in deep, 90% eggs (10% water); diver's gut (original) estimate=30,000; estimate was later calculated assuming 800 thousand eggs per inch quadrat depth, inches of egg slurry, and % of eggs in slurry (800*41*0.9), do not calibrate | 29520 |
| 2023 | 7 | None present | loose; 31in deep, 95% eggs (5% water); diver's gut (original) estimate= 20,000; estimate was later calculated assuming 800 thousand eggs per inch quadrat depth, inches of egg slurry, and % of eggs in slurry (800*31*0.95), do not calibrate | 23560 |
| 2023 | 7 | None present | loose, 23in deep, 95% eggs (5% water); diver's (original) gut estimate = 7000; estimate was later calculated assuming 800 thousand eggs per inch quadrat depth, inches of egg slurry, and % of eggs in slurry (800*23*0.95), do not calibrate | 17480 |
| 2021 | 11 | None present | loose; eggs 24" deep, no veg, assumed 21" of solid eggs, estimate calculated assuming 800 thousand eggs per inch quadrat depth, do not calibrate | 16800 |
| 2023 | 7 | None present | loose; 20in deep, solid eggs; diver's (original) gut estimate= 8,000; estimate was later calculated assuming 800 thousand eggs per inch quadrat depth, inches of egg slurry, and % of eggs in slurry (800*20*1), do not calibrate | 16000 |
| 2021 | 10 | None present | loose; eggs shoulder deep with a little veg.; assumed 8" deep of solid eggs, estimate calculated assuming 800 thousand eggs per inch quadrat depth, do not calibrate | 6400 |
| 2021 | 11 | None present | loose; eggs 14" deep, assumed 8" of solid eggs, estimate calculated assuming 800 thousand eggs per inch quadrat depth, do not calibrate | 6400 |
| 2021 | 11 | None present | LOOSE | 6000 |
| 2021 | 11 | None present | loose; eggs 12" deep, assumed 7-8" solid eggs, estimate calculated assuming 800 thousand eggs per inch quadrat depth, do not calibrate | 6000 |
| 2021 | 11 | None present | LOOSE | 6000 |
Those notes describe something that I've never read about in any of the zillions of historical newspaper articles. I can't refer you to a single article from Anywhere, Alaska, or Anywhere, BC, or Anywhere, Washington, from 1888 or 1927 or 1973 or 1997 or any other year, that describes what these notes are describing: 41 inch, 31 inch, 24 inch deep mats of loose eggs piled on the shoreline. I can't refer you to testimony, I can't refer you to scientific articles, I can't refer you to anything that describes what this data sheet is describing.
All I can refer you to is a study of egg survival by density for Atlantic Herring eggs in the Baltic Sea. That study found that with every additional layer of eggs, survival went down, until there was no survival at all for the 10th layer of eggs (Finke et al., 2022) or deeper. Additionally, even the top layers survived more poorly with each additional layer below in that study. 10 layers of eggs would be less than an inch. That study wasn't talking about 3 foot high masses of egg slurry.
I don't think anybody would advocate that this is a good reproductive strategy for herring. The eggs in these super-dense samples probably all rotted and badly.
Now I want to zoom out and tell you a bit about the whole data set:
In total, ADF&G collected 4083 samples; 1546 of those came from 70 transects in 2021; 1339 came from 50 transects in 2022; 1198 of those came from 60 transects in 2023. The grand total of eggs assessed in those 4083 samples in the course of those three years was 615,047K; from the egg count for each year, a much larger number was extrapolated to describe the total assumed egg deposition in Sitka Sound; from that total figure, the biomass was then calculated and the next year's forecast conjured. In 2021, 27.3 trillion eggs were assumed present. In 2022, 14.57 trillion. In 2023, 19.9 trillion.
What I want to emphasize is how much of the total number of eggs was from unusual and likely unviable egg-masses like those described above. What I noticed in studying this spreadsheet is that approximately one third of all of the eggs counted between 2021 and 2023 were found loose and thick with no vegetation present.
Of the 615,047K total surveyed eggs, 215,827K were found "loose" according to the comments column. The sum total of eggs where the vegetation type column indicates "None present" was 203,339K.
189,678K eggs match both categories - loose with no vegetation present.
Those numbers are all in the ballpark of 1/3rd of the total eggs – found and surveyed in settings that aren't typically thought to favorable for herring, and certainly not considered good for subsistence food.
Next I want to illustrate how a major proportion of the total egg count of the last few years can be attributed to a very small number of very large samples. I noticed that 29 of the 4083 samples consisted of 2,500K eggs per sample or more - extremely high results. 8 of these higher samples were on macrocystis and one on hair kelp, the other 20 (and most of the very highest samples) were loose w/ no vegetation. Add up those 29 samples (0.7% of the samples) and 200,880K - 32.6% - of the total sampled eggs are accounted for. The sum of the remaining 4054 samples (99.3% of the samples) is 414,167K eggs - 67.3% of the total.
0.7% of the samples produced 32.6% of the total egg count. That's not normal!!
Where this all comes together and becomes really quite staggering is when the 2023 results are isolated from the other years.
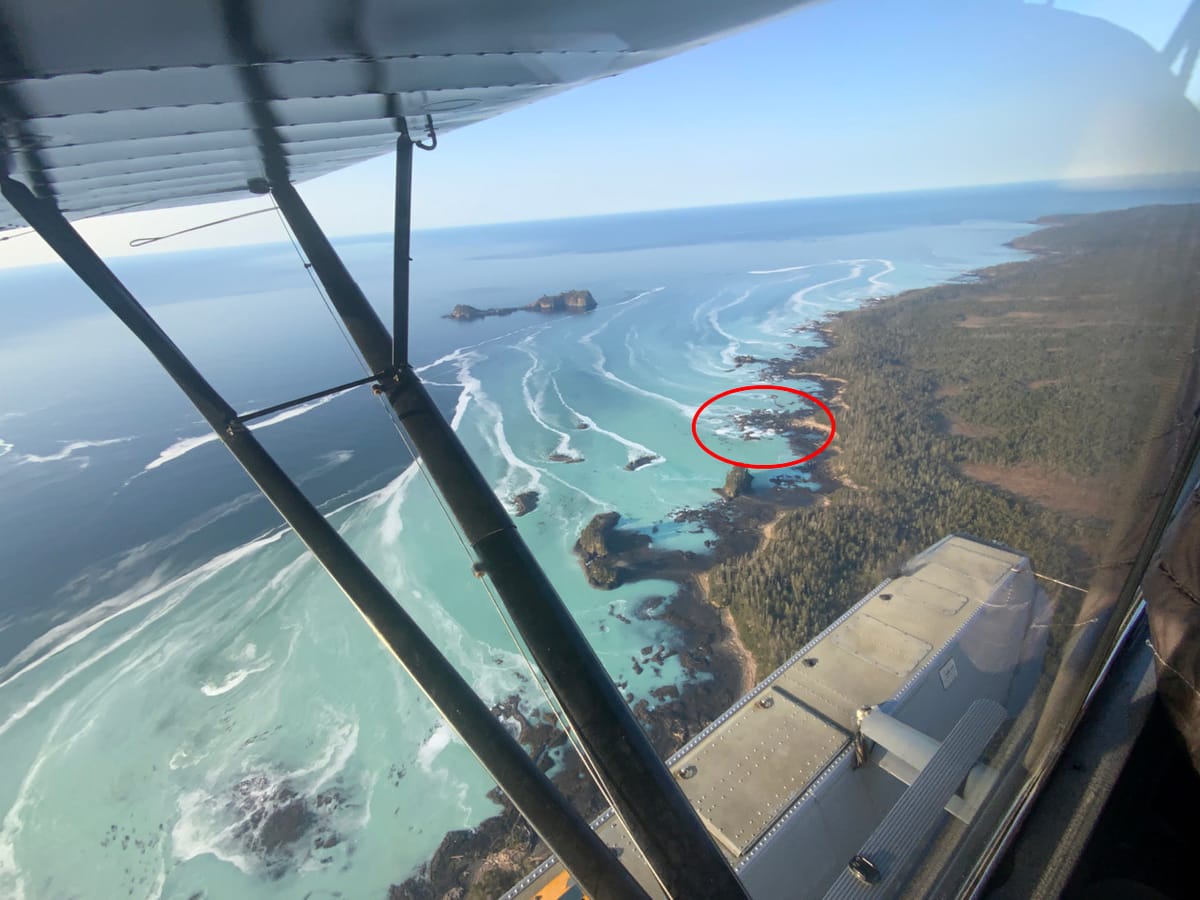
I mentioned earlier that in 2023, there were 60 transects resulting in 1198 samples. The sum total of those 1198 samples was 194,012K eggs. The four largest samples (representing 0.3% of that year's samples) all came from the same single transect on the south Kruzof shoreline north of St Lazaria Island, and they added up to 86,560K eggs – 44.6% of the total eggs seen in surveys for the year.
0.3% of samples produced 44.6% of the eggs encountered in the 2023 survey effort.

This scrap started by pointing out that ADF&G overforecast 2024 by double on the strength of their 2023 data. I've just illustrated that nearly half of the eggs encountered in Sitka Sound in 2023 (and used to inform the 2024 biomass forecast) came from one extraordinarily unusual transect.
That transect - which is probably simply the product of some weird phenomenon with currents - contributed mightily to the averages which were then extrapolated to the entirety of the Sitka Sound spawning grounds, even though there is no evidence it was representative of elsewhere in Sitka Sound. A falsely high biomass forecast was a guaranteed result of over-extending this data. No other outcome was more likely.
In case you're interested, here's the full entry for that Baltic Sea study about low herring egg survival at high densities:
Finke, A., Von Nordheim, L., Kotterba, P., & Polte, P. (2022). Impact of spawn concentrations on Atlantic herring (Clupea harengus) egg survival in Baltic Sea inshore spawning areas. Estuarine, Coastal and Shelf Science, 275, 107961. https://doi.org/10.1016/j.ecss.2022.107961


