Herring Scrap 34: Pen Pals 2 (Alaska Public Records Act Request, 1984)

As I wrote in the previous scrap about my Alaska Public Records Act request, 1984 was the only year for which I received most of the information needed to make sense of the nature of the spawn deposition surveys in the years with suspect data. Notably, '84 was the only year under request for which ADF&G could provide their calculation by which total egg deposition was derived from transect data.
That in itself is probably the most major finding of this record request project: for 1985, 1986, 1988, 1989 - the other years that were part of my Records Request - the egg deposition listed for those years cannot be reproduced with the data that ADF&G has on hand. That's remarkable, given that the egg deposition time series is the bedrock of the Statistical Catch At Age (SCAA) and Age Structured Analysis (ASA) models used by ADF&G to rationalize the fishery since 1994.
But for 1984, there is enough information that we can at least try to understand how ADF&G deduced the escapement biomass for that year, as well as whether or not the egg deposition that ADF&G references for 1984 is based on the best available information. That's what this scrap is about.
Nowadays, the models used by ADF&G say that there were 3.25 trillion eggs in Sitka Sound in 1984. I wanted to know: did this number come from the observational data generated by that year's surveys? I'll tell you now: 3.25 trillion is not a number that shows up in these documents.
The other number I wanted to figure out the basis of is the escapement biomass from 1984, which was carried forward to inform the quota for the 1985 season - 38,500 tons (77,000,000 pounds). How was that number arrived at?
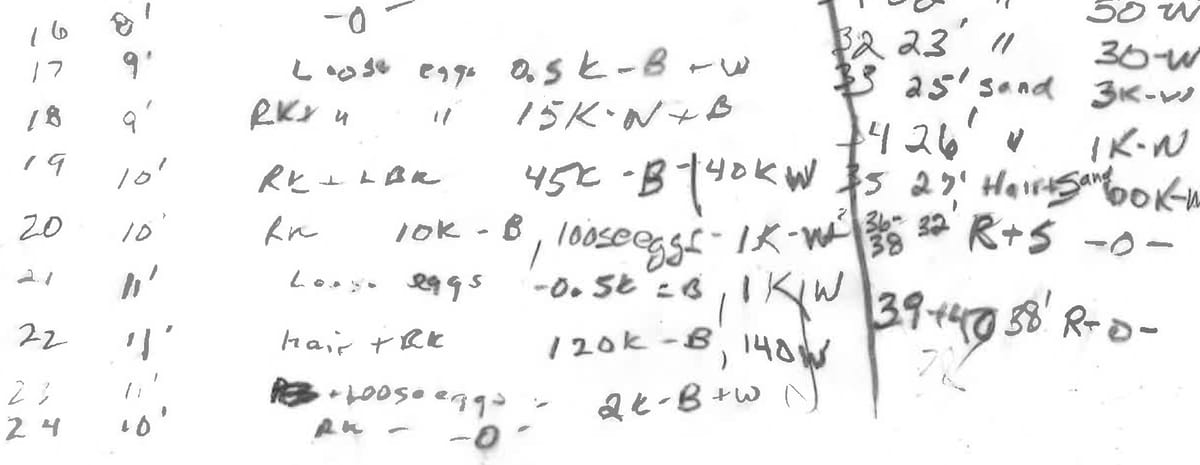
I found the relevant calculations on page 13 and 14 of the document labeled 1984 Sitka herring dive survey data and calibrations.pdf. Here is the first calculation, which suggests that the actual egg count in 1984 resulted in a figure that was hundreds of billions of eggs greater than the number referred to by ADF&G today.

You can see there that the total number of eggs based on the dive surveys was thought to be 3.47 trillion before egg loss was accounted for. Assuming 10% egg loss, that means (3.47 trillion divided by .9) that the observational studies in 1984 would have yielded an estimate of some 3.86 trillion eggs. It isn't galaxies away, but 3.86 trillion eggs is quite different than the 3.25 trillion eggs that the Department refers to today. The important thing isn't the distance between the two numbers; what's important is that one is based on observational dive surveys, and one isn't. ADF&G is currently referencing the number that isn't based on observational evidence, and there's no basis for it, and there's no reason to think that the same isn't also true of the data for the rest of that decade. And so even though there is just a 19% difference between the two figures for 1984, we cannot assume that the difference between the observational value (which we can't glean, because apparently that data doesn't exist) and the surrogate value for the other years isn't greater than 19%.
What do I think happened? I've looked at this every way I can, and the only thing that I can think of is that when ADF&G switched to age structured analysis in 1994, nobody felt like burrowing around in disorderly filing cabinets to figure out what the observational data said, and shortcuts were taken as a result; the egg deposition numbers - which up to that point had only had temporary importance in determining the next year's biomass, and weren't yet a feature of a long-term model - were retroactively derived from the nautical miles of spawn using the simplified calculation that I described in scrap 30: every mile of spawn equals fifty billion eggs. Thus, all of the hard work of those dive surveys disappeared into nothing.
Next let's take a look at what the records tell us about where the escapement biomass figure for 1984 came from - again, that was 38,500 tons (77,000,000 pounds). The calculation that I showed you above yields two escapement estimates, one based on a 10% egg loss and the other based on a 25% egg loss. But neither of those match 38,500 tons (77,000,000 pounds). How was that number reached? The answer is Blame Canada on the next page (14) of 1984 Sitka herring dive survey data and calibrations.pdf:

Turns out that ADF&G was looking for a shortcut for estimating fecundity (the number of eggs per fish), presumably so they could avoid the extraordinarily tedious work of doing regular fecundity estimates (this is something that they still avoid today; they haven't done a new fecundity study in over 20 years). In the calculation above, they simplified their calculation by applying the generic assumption used by DFO in Canada - that 100,000,000 eggs represented 1 ton of spawners. Simple, easy, quick (you might remember from Scrap 30 that this is one of the two shortcuts that were used to derive both the biomass AND the egg count estimate from the nautical miles of spawn in the absence of a thorough study in 1981) - and completely indifferent to the realities of the vast difference in fecundity between bigger older fish and smaller younger fish. Whereas in the previous calculation ADF&G referenced their own outdated fecundity data, this time they ran their egg count through the simplified fecundity assumption before accounting for 10% egg loss.
Lo and behold, this simplified calculation yields a match for the figure that ADF&G ended up using to describe the escapement biomass for the year: 77 million pounds of herring.
I had imagined that there were methodological shortcuts used to figure out the biomass and the egg deposition; I hadn't quite imagined that the entire observational content of multiple studies would be rejected in order to get there.
I have to assume at this point, given that no data was presented to lead me to any other conclusion, that the same thing occurred for 1985 and 1986, and that something similar happened in 1988 and 1989.
Now that I've described all of that, I want to go back to the line graph that I showed you in scrap 30, where I chart egg deposition (in trillions) per nautical mile of spawn. We know that the dive studies have been consistently thorough in the last couple decades; that's the right side of the chart. We now know that the egg deposition survey data for 1981 and 1984-199x is either unavailable OR has been replaced by surrogate data - years represented by the flattish line on the left side of the chart. I can't tell you with any certainty what happened in the middle of the chart, in the 1990's. For the more recent years that we know refer to observational data - the right side of the chart - the data shows an erratic pattern that is in stark contrast to the years that seem likely to refer to surrogate data.

And so even though for 1984 we can figure out that the difference between the observational value and the surrogate value was just 19% (you can imagine the data-point 1984 at 0.06 trillion eggs rather than 0.05 trillion eggs per nautical mile of spawning), we have no reason to believe that, if the left side of the chart were based on observational data, it wouldn't be just as erratic as the right side, perhaps within a similar range. Just because the distance between the observational and the surrogate value in 1984 wasn't enormous doesn't mean that it wasn't enormous for other years that we have even less information for.
If you believe that much, or even half that much, then you're with me: the biomass time series and the Unfished Biomass Simulation Study has a rotten foundation!
In the next scrap I'll describe some other key findings from this records request and develop this idea a little more.


