Herring Scrap 30 - An Open Letter to the Authors of the Unfished Biomass Simulation Study
A letter to ADF&G staff describing the low quality and inconsistent historical data serving as the foundation for the Simulation Study to Determine Unfished Biomass of herring in Sitka

Dear ADF&G Biometricians,
In your recent Simulation Study to Estimate The Unfinished Biomass [𝐵0 ] of Sitka Sound Herring, you offer that "the validity of the reported estimate for 𝐵0 of Sitka Sound herring relies on the ability of the 2023-forecast SCAA model to accurately describe the spawning stock biomass over time as well as to estimate maturity and survival parameters".
I am writing today because, having reviewed the Simulation Study, it appears that the 2023-forecast SCAA cannot possibly accurately describe the spawning stock biomass over time based on the data it is being provided; thus, the Unfished Biomass estimate must be invalid. I believe that the resulting B0 is an irresponsible and intensely biased estimate, and I think it is important that the study be retracted and revised.
Recognizing that decisions are actively being made based on your publication, I have prepared my observations on this matter as an open letter. In it, I focus on a set of key observations that lead me to believe that the 2023-forecast SCAA model is critically flawed and reliant on a corrupt data series:
- The Simulation Study describes the original 1981 biomass estimate as being derived from hydroacoustic surveys. This is false: the 1981 biomass estimate was derived neither from hydroacoustic surveys nor spawn deposition surveys. ADF&G reporting for that year indicates that data from dive surveying was very limited. Unable to use the data, the reporting indicates: "Data limited, satisfied at least 1x10⁶ pounds/linear mile or 60x106 pounds biomass". Thus, the 30,000 ton biomass in 1981 was reported as a minimum.
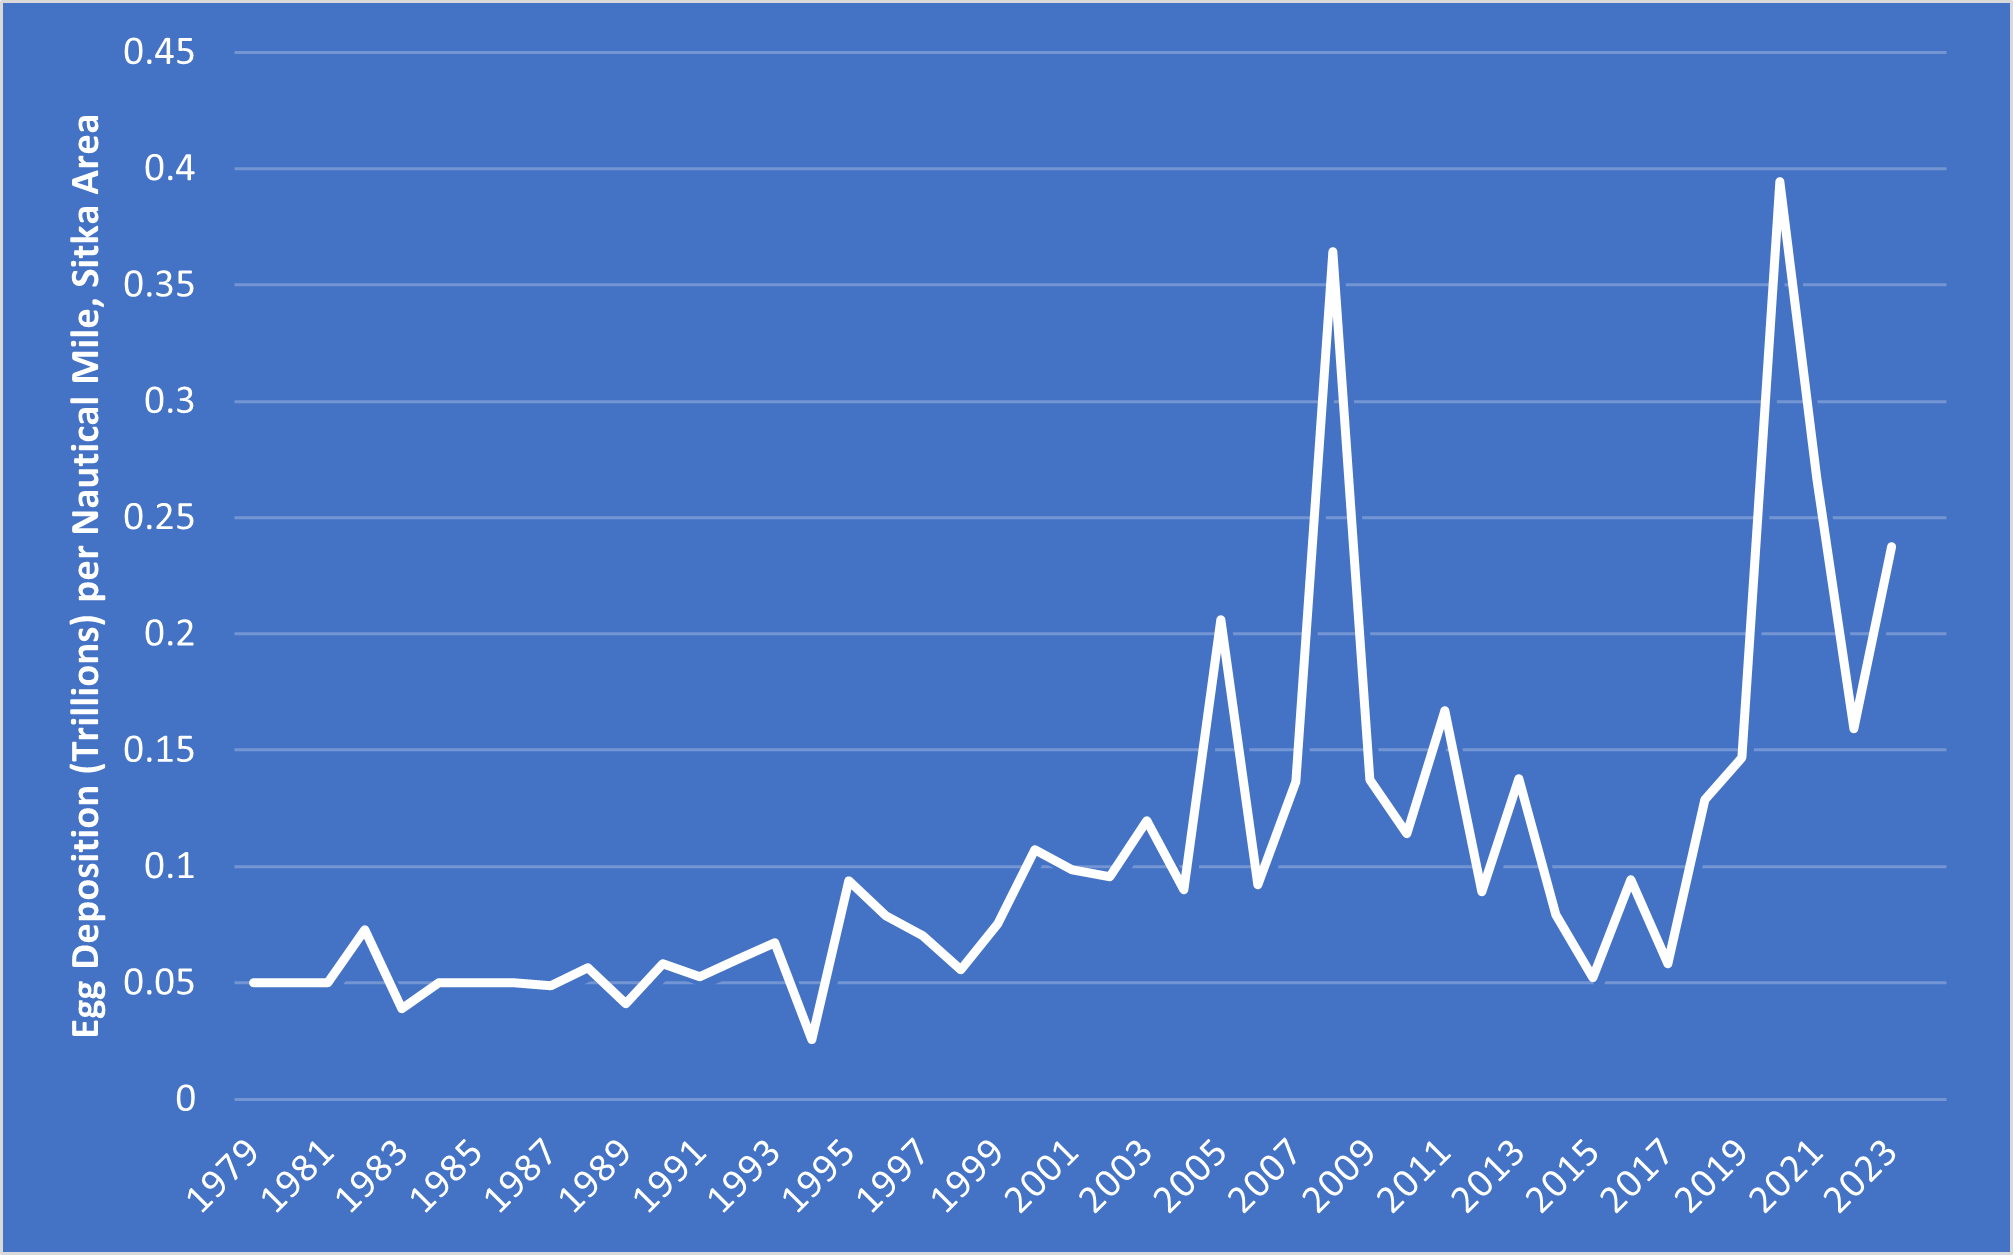
- That biomass figure - 60,ooo,ooo pounds - was derived directly from nautical miles of spawn via a convenient conversion factor that that assumed two things: 1) one million pounds of herring per nautical mile of spawn; and 2) 100,000,000 eggs per ton (2000lb) of herring. Put those together and you get a conversion to serve as a minimum when a formal egg deposition survey can't be accomplished; every mile of spawn equals 500 tons of herring equals fifty billion eggs. The chart in the header tracks egg deposition per mile spawn using ADF&G data. The near-static assumptions on the left side of the graph give way to the more thorough (and better-documented) egg deposition studies since the 1990's. The right side of the graph presumably represents a more natural range and variability.
- The Simulation Study assumes that thorough dive surveys resulted in reliable spawn deposition estimates for 1984, 1985, and 1986. This is not evident in the available data. The same convenient conversion was used for those years, presumably, given the absence of data, for the same reasons - "data limited, satisfied at least 1x10⁶ pounds/linear mile" - as for 1981.
- Those calculations hinge on a simple fecundity conversion - 100,000,000 eggs per ton. It needs to be noted here that that conversion, applied in Sitka in the 1980's, was based on fecundity data from herring from 1970-71-72 (Blankenbeckler and Larson, 1987, report 202 table 13). I mention this because the study hangs on the premise that everything changed for Sitka herring in 1976, in terms of ocean conditions. If the report's validity hinges on ocean conditions changing radically in 1976, and biomass assessments in the post-1976 period hinge on biological data from the pre-1976 period, what does that mean for assumptions of the study, anyhow?
- The results of the dive surveys in 1982, 1983, and 1987-1991 are more thorough than in 1981, 1984, 1985, 1986, but are still working within a different standard than became the norm after 1992. There is no transect data for '84-'91, for example. I have seen no clear formula by which total egg deposition may have been derived from transect data for any of those years in order to mathematically apply the data to the biomass question. In your Study, you allow that "raw data were not available", for these years but you seemingly make an assumption that raw data did, at one point, exist. However, review of the annual reporting leaves no reason to believe that the conclusions about total egg deposition in Sitka for those years are anything more than impressionistic guesses according to a relative index where normal is represented, more or less, as 1,000,000 pounds of herring per nautical mile. This approach is evident in the 1987-1991 research report. What evidence is there to show that egg density was carefully assessed and used to come up with a whole-area estimate that might stand the test of time during those years? I see none.
- In all well-documented studies of egg deposition in Sitka Sound, the million-pounds-per-mile mark has been exceeded. Time has proven that the initial purpose of that conversion in 1981 - to serve as a safe minimum in lieu of good data - was apt.
- The Simulation Study relies on SCAA model output of recruitment from years where hydroacoustic studies were used to determine biomass (1976-1980). What you refer to as the biomass for those years is merely the highest single survey done using primitive hydroacoustic gear. For instance, the forecast biomass for 1979 was the product of a single survey in Olga Straits that yielded an estimate of 62,764,025 pounds (Dennis Blankenbeckler and Robert Larson, 1978). From the reporting for 1979:


At left, an excerpt from the tables of hydro-acoustic survey results, with biomass estimate in the right-most column. The image at center corresponds to survey run #2 on January 10th, 1979, on the Sitka side of Olga Straits. The squiggly-line area represents the survey area, a small portion of Sitka Sound. The biomass estimate from that survey was the highest single survey of the year. At right, we can see that the Acoustical Estimate of Abundance for Sitka Sound for 1979 is 62.7 (million pounds), corresponding to the amount located in that single survey on January 10th, 1979. From technical report #202, 1987.
- The above figures illustrate a simple point: To describe the biomass of the entirety of Sitka Sound according to those hydroacoustic assessments is to assume that there were no herring elsewhere in Sitka Sound in the midst of those surveys, and that no herring from outside of Sitka Sound joined the spawning aggregation from elsewhere (or spawned, undocumented, elsewhere in the large Sitka area) in the following three months, and that those hydroacoustic surveys truly captured the herring abundance under observation in those locations. Those ideas aren't realistic or sensible and are, in fact, preposterous. The hydroacoustic survey estimates - hard earned with primitive technology - must be treated as absolute minimum population estimates for those times. The severe limits of those 1970's hydroacoustic studies must be taken more seriously by the Department.
Between 1987 and 1991, the Department experimented with comparing the results of hydroacoustic surveys and spawn deposition surveys for different areas. The figure below illustrates the radical difference between hydroacoustic studies and spawn deposition surveys for Sitka Sound – the comparison was attempted just once, and the assessed biomass based on the spawn deposition survey was nearly three times (91.2 million pounds) that of the hydro-acoustic survey (32 million pounds).

- So between those hydro-acoustic survey years and those under-parameterized spawn deposition survey years, there are all of these years early in the research program going into the model based on minimum population levels provided by a mash-up of low-resolution data sources. The critical result is that the lower strata (as depicted in the below figure from your Simulation Study) of this Unfished Biomass model is populated almost exclusively with those years in the time series for which the data is of the lowest quality. That the years with the lowest quality data so consistently overlap with the years of lowest assessed biomass should tell you something is amiss.

- All of the above describe a situation where the Unfished Biomass provided by ADF&G in the 2024 Simulation Study for Sitka herring is anchored by partial, outdated, and non-existent biomass assessments. This is inappropriate and highly consequential. If uncorrected, the Board of Fisheries will be tempted to use this Unfished Biomass figure to set a threshold at 26,000 tons, and all of the harvest formulas will unfold from that number. Meanwhile, this notion of Unfished Biomass will obfuscate the ecological history of Sitka Sound by radically misrepresenting historic data, setting false and risky baselines for conservation action and undermining local and indigenous experiential and observational knowledge.
- Back in 1992, the area manager for ADF&G reported that 1992 was the 14th consecutive year that the Sitka Sound herring stocks “have been at high levels and resulted in good catches" (Sentinel 1992-4-7). Let me repeat that: every year from 1979 to 1992 was considered by the department to have a healthy or very healthy herring biomass, even though Department statistics now suggest that that was a low time compared to present. Can you explain that statement from the perspective of your current historicization of herring biomass? Do you think he was right or wrong, and on what do you base that assessment?
- I note here that ADF&G reports an average of 61.5 nautical miles of spawn and 39,000 ton biomass for the period from 1979-1992, and a 61 nautical mile of spawn and 90,000 ton biomass for the period from 1993-2023. I've read your new study. I've read the old reports. I don't believe that you will be able to furnish me with transect data from 1984-1991, nor with the math (besides that described above) linking that transect data to the biomass assessments for each of those years. If I'm wrong in that, would you please be so kind as to share that data with me and accept my apology for making a scene? If I'm correct though, it suggests that ADF&G has statistically conjured a false period of depletion in the 1980's and into the 1990's by referencing outdated departmental assumptions in the absence of real data.
- Among other consequences, the simulation study returns an Unfished Biomass that is far too low.
Please let me know if I can provide any further support,
Peter


