Herring Scrap 17
OR: The Risks and Rewards of Counting More Herring Than Ever
Last Friday, Alaska Department of Fish & Game (ADF&G) released the annual numbers that will guide the conduct and limits of the springtime 2024 Southeast Alaska commercial herring sac roe seine fishery in Sitka Sound (I’ll refer to it as ‘the Fishery’). Those numbers are the “mature herring biomass” and the Guideline Harvest Level (GHL). The GHL is the amount of herring that the 48 permit holders can collectively take from the waters of Sitka Sound; the figure is derived from the biomass and, except in very lean years, is set at 20%. Thus, this year’s estimated biomass of 408,228 tons means the Fishery is permitted (by the GHL) to harvest up to 81,246 tons of herring.1 [footnote: ]
That’s a record-smashing biomass figure (ADF&G’s 12th such record since 1979, for what it’s worth) yielding an extremely high GHL. The high biomass figure describes a promising and hopeful time for herring in Sitka Sound, and I believe these numbers enough to trust that everycreature who’s anycreature will be there if they can get there this spring. That creaturely aggregation is something that you sort of have to see to believe, but here’s a phone video I took a few years ago, trying to capture the scale of bird presence on spawning grounds. The event of it is spectacular and impressive. You get the feeling that everybody has planned all year to be in Sitka for herring season and is ready to eat.
So, y’know, a lot of herring: that’s really good. If you accept ADF&G’s biomass numbers, then it is plain to see that two years without fishing - for the first time in 40 years - was followed by a massive biomass bloom of a sort that ADF&G has never before seen! And you’ve gotta love that. And when I think about a growing population about herring, my mind wanders to the years in between: to Sitka (and all coastal Alaska), 2015/2016, when there were dead murres showing up everywhere, emaciated ; in Sitka, 2022, when grey whales who may have been doing a lot of starving and dying lately showed up and plain gorged on herring for weeks and it was awesome; to the birds aswirl all around in 2021 in that video. I think about about starvation in the ocean and how good it is to have lots of herring around, how wonderful it would be if a resurgent Sitka could spill into a wider resurgence for the under-recovering herring of Southeast Alaska. This is a really good time to promote that path, I think!
The bad news is in that GHL number. The GHL of 81,246 tons of herring - the amount that ADF&G would be comfortable seeing a commercial fleet take in a month in Sitka Sound this spring - is equal to the amount taken in all the years between 1979 and 1992 combined! The scale of disruption required to catch that amount of spawning herring would be extraordinarily invasive, and even though it seems highly unlikely that it will even be approached (most ever was 25,090 tons in 2022, last year was just over 10,000 tons), it is alarming that it is on offer.
Biometrics and the Incredible Expanding Biomass
In some upcoming posts, I’ll try to elaborate on just what alarms me about the state of herring numerology in Sitka, but the short version is this: ADF&G is counting more herring than they used to and using the larger count to justify taking more fish.
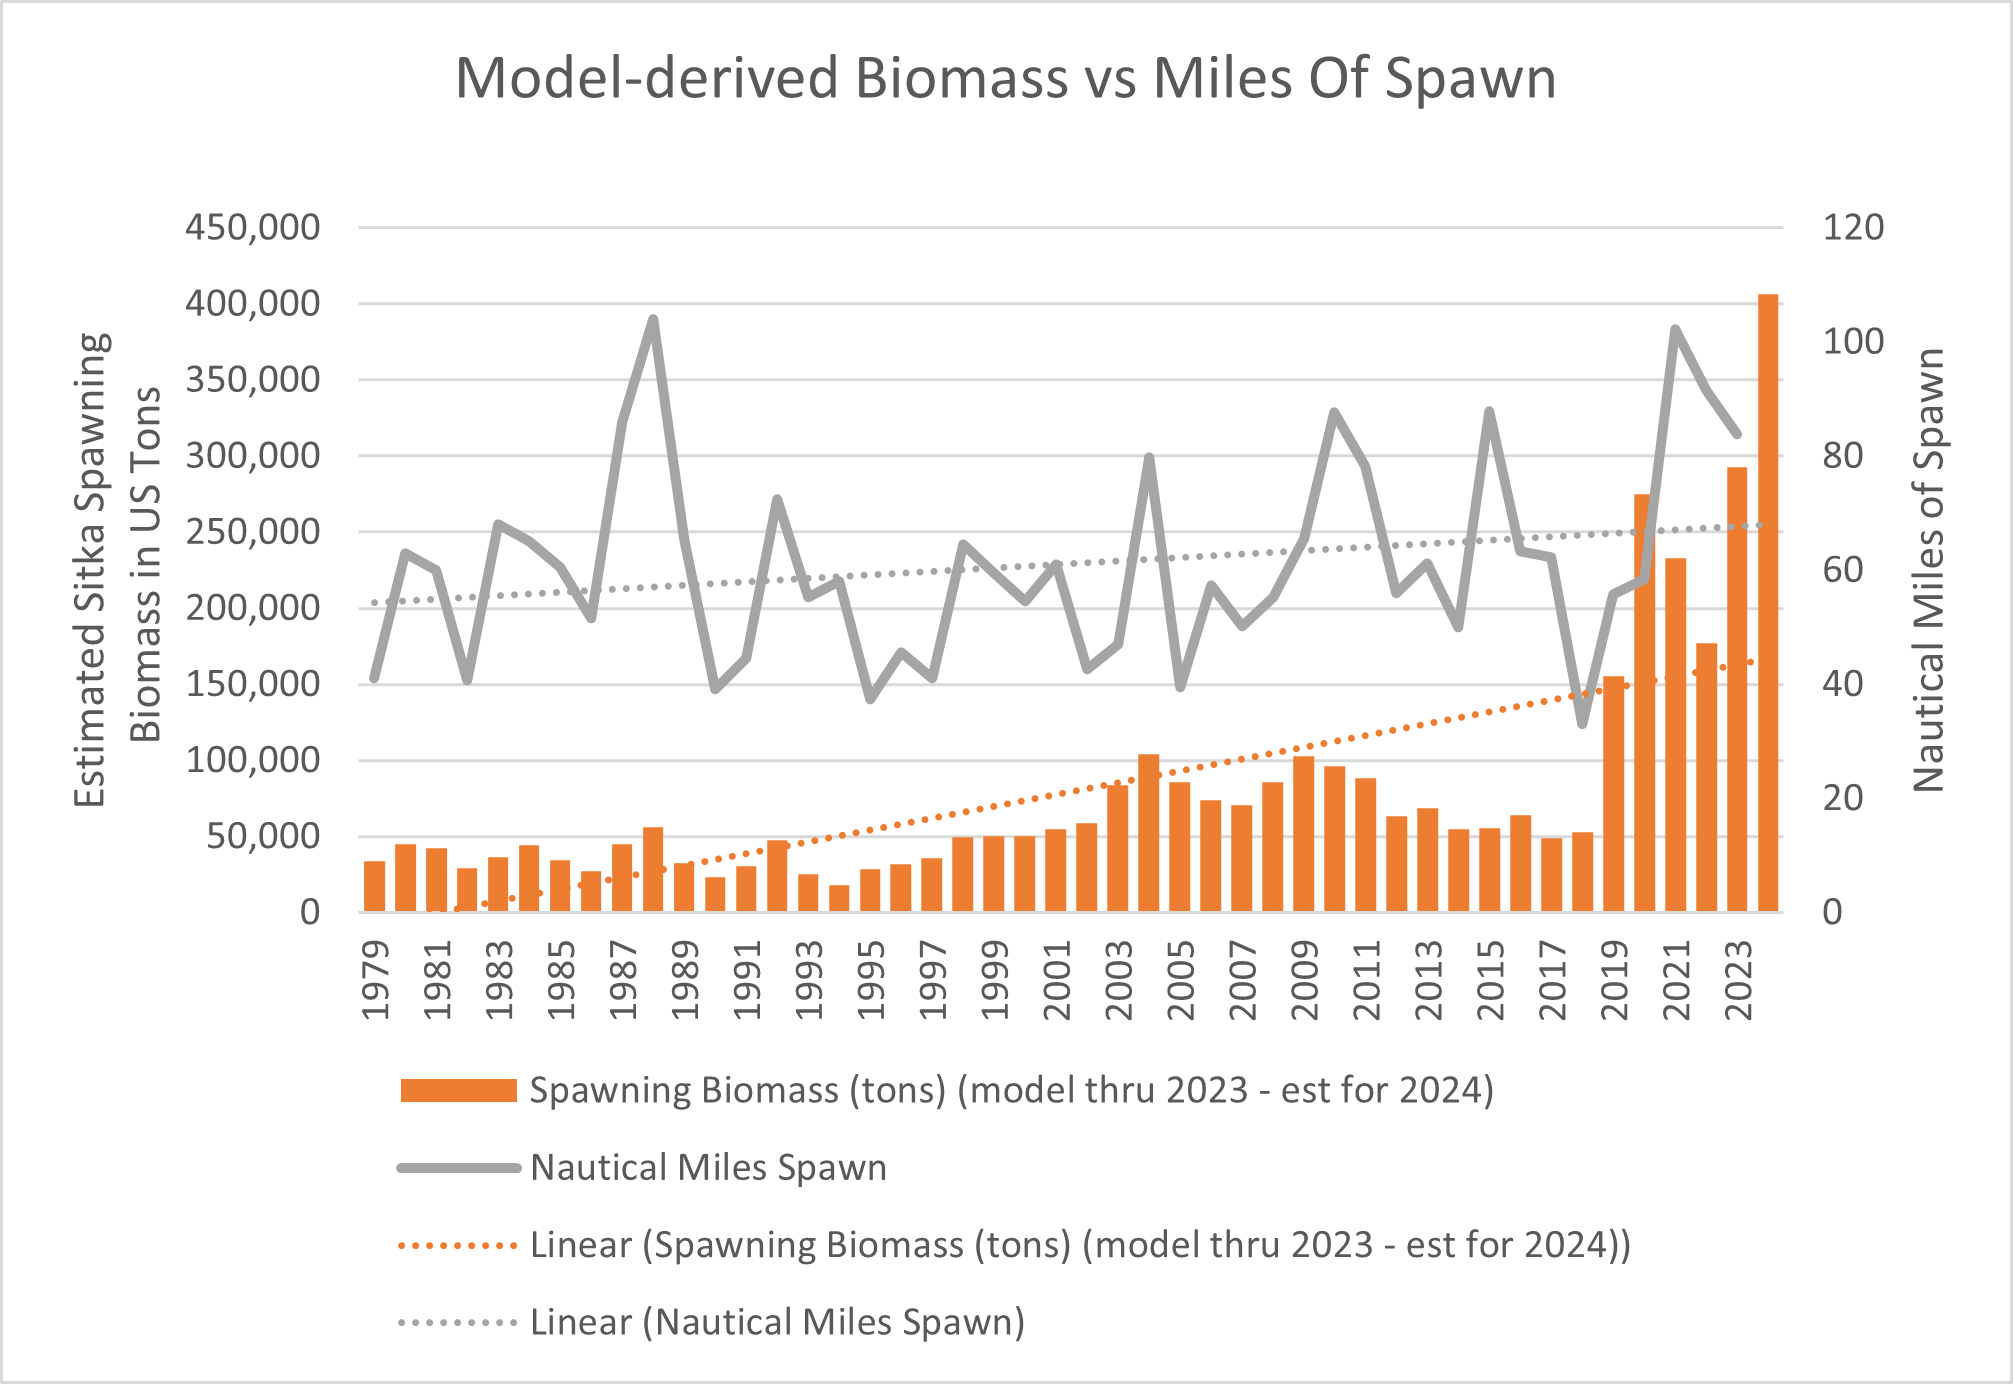
To start to get at what I’m talking about, I want to show you a chart I made from publicly available ADF&G data2 in which the model-derived biomass is represented by orange bars using the left-side scale in tons, and the nautical miles of shoreline receiving spawn is represented by the squiggly gray line using the right-side scale in miles:

One would reasonably expect that more herring would mean more miles of spawn, generally speaking, and that more miles of spawn means more herring. That’s evident in this chart to some extent (see the slow-rising trendline for miles of spawn compared with the fast-rising trendline for biomass), but, well… let me highlight two particularly unusual features on this chart which tell me that the data is probably off kilter.
1988 is the year with the highest recorded miles of spawn (104) (the peak of the gray line). That record has stood the test of time, even as aerial surveying has become more thorough (now near-daily, regularly surveying a wider range). Despite that extraordinary biomass, the model says that the Sitka herring biomass for 1988 was just 52,565 tons - a lower biomass than the model reports for all but one year since 2001!
On the other hand, 2018: a bleak year for herring in Sitka, and an awful year for subsistence herring roe on hemlock & kelp harvesters, we can see in the chart that it was the lowest miles of spawn in the whole time series at 33.1 miles. AND YET: the model assures us that 2018 had a higher biomass than each of the 21 years prior to 2001.
Those two strange features, which don’t make a lick of sense within the overall time series, can be resolved with one simple assumption: the historic biomass figures were artificially low. The biomass must have been larger in 1988 to produce that unchallenged spawn mileage record.
Once you allow that assumption to flourish, it becomes sort of obvious in the record: the estimated biomass is becoming less attenuated over time, as the ADF&G research program develops techniques for efficiently enumerating schooling migratory forage fish in an expanding area. Technology and practice and expanding area and a value-enhancement mandate has made them more effective herring counters, thus they are counting more herring into the biomass, thus the commercial fleet is allowed to catch more herring according to the GHL.
The ADF&G generated biomass of herring is a bland CGI version of the real thing, an artificial construct derived from known bits of reality. I think it’s instructive and troubling to understand how those numbers have been constructed over time, like monuments about good fisheries management. I’ll keep coming back to changes in the ways and means of how biomass is measured and further interpreted by the model(s) as I go.
I hope to get you interested in ADF&G’s long quixotic quest to better enumerate Sitka herring. Those numbers are the key products of ADF&G’s herring research in Sitka, expensive pseudo-scientific products paid for in fish death and tax dollars whose primary beneficiary is a private fishery that needs to know how much it can take and wants that limit high enough that it can take as much as it wants. I hope to share whatever insights I can regarding why a harvest of 81,246 tons of herring from Sitka Sound should never be on the table.
Thanks for reading,
pb
Compare 408,228 tons to the 45-year 1979-2023 average biomass estimate of 64,296 tons; compare 81,246 tons to the 45-yr average GHL of 11,553 tons. ↩
Data for this chart came from the table at https://www.adfg.alaska.gov/index.cfm?adfg=commercialbyareasoutheast.herring#harvest, updated with information from the recent news release (http://www.adfg.alaska.gov/static/applications/dcfnewsrelease/1552946314.pdf) ↩


